– Pilot, give me numbers!
– 36!
– What 36?
– What numbers?
This is an average picture of storage synthetic benchmarking today. But why? It was fine just a couple of years ago.
Until about 10 years ago most storage systems were flat arrays with uniform access. It means that arrays were created with big number of the very same disks (performance wise). For ex. 300x 15k disks. Uniform access means that access time to any data block is the same (not counting cache). Pretty the same story as with UMA/NUMA systems, the same principle.
About 10 years ago non-flat storage systems were introduced with SSD storage tier. Access time varies block-to-block now, and more interesting – completely unpredictable depending on vendors algorithms. Story was more or less settled, but guess what happens?
HCI with data locality appeared – NUMA of storage systems, or should we say NUSA (Non Uniform Storage Access)? Storage performance depends now on another factor – is data on particular node or should we travel through network. Our favorite synthetic tests such as single IOmeter with usual data access patterns now make a little sense. Real production workload is the only way to determine if multi-node HCI is suitable for real production workload. But what if we cannot move production due to security or cost considerations? Is there any other way?
Let’s pretend we have real production workload and put a load on whole HCI cluster. Strike out “100% random” on whole volume – this test won’t show us anything except performance of the lowest tier, and we can easily predict these numbers. 150-300 IOPS per node (2-4 SATA disks).
So what we need?
- 1 workload generator VM per node is a minimum.
- Workload profile similar to production.
For mass workloads such as VDI we have to create representative VM number. 100% equivalent to production is ideal, but as most demo systems we can use are 3-4 nodes there is no way to put 3000-4000 VMs there.
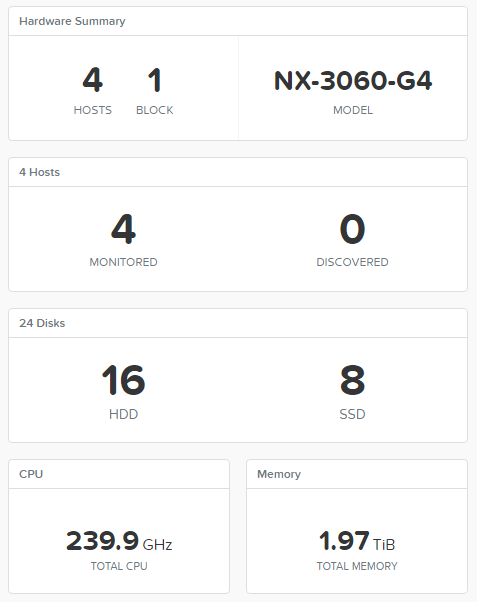
I will show you how to create benchmarking tool for HCI that makes sense. All next steps and screenshots are for Nutanix NX-3460G4 as I had this system, but you can easily reproduce the same story for any other system you have. Moreover, you can test classic FC SAN the very same way 🙂
I’ve used CentOS 7 with FIO as workload gen with workload profiles from Nutanix XRay 2.2. Why CentOS? ISO was already on my hard disk, nut you can use any other system you like.
Now we create several FIO VM templates for different workloads.
1. FIO Management – 1 vCPU, 2GB RAM, 20GB OS
2. DB – 1 vCPU, 2GB RAM, 20GB OS, 2*2 GB Log, 4*28 GB Data
3. VDI – 1 vCPU, 2GB RAM, 20GB OS, 10 GB Data
Let’s create FIO management VM with CentOS minimal install.
Now FIO installation.
# yum install wget
# wget http://dl.fedoraproject.org/pub/epel/testing/7/x86_64/Packages/f/fio-3.1-1.el7.x86_64.rpm
# yum install fio-3.1-1.el7.x86_64.rpm
Repeat the same steps for workload gen templates, minimal install for OS disk and we don’t touch other disks yet. Autostart FIO
Create file /etc/systemd/system/fio.service
[Unit]

Description=FIO server

After=network.target

[Service]

Type=simple

ExecStart=/usr/bin/fio --server

Restart=on-failure

RestartSec=5

[Install]

WantedBy=multi-user.target
# systemctl daemon-reload
# systemctl enable fio.service
# systemctl start fio.service
# firewall-cmd –zone=public –permanent –add-port=8765/tcp
Infrastructure is ready now and we need workload gens.
We create gens list
10.52.8.2 – 10.52.9.146
Excel as you know, is the most popular IP management solutiion in the world.

Upload this list to FIO management VM. Also we upload FIO config files with workload description.
fio-vdi.cfg
[global]

ioengine=libaio

direct=1

norandommap

time_based

group_reporting

disk_util=0

continue_on_error=all

rate_process=poisson

runtime=3600

[vdi-read]

filename=/dev/sdb

bssplit=8k/90:32k/10,8k/90:32k/10

size=8G

rw=randread

rate_iops=13

iodepth=8

percentage_random=80

[vdi-write]

filename=/dev/sdb

bs=32k

size=2G

offset=8G

rw=randwrite

rate_iops=10

percentage_random=20
fio-oltp.cfg
[global]

ioengine=libaio

direct=1

time_based

norandommap

group_reporting

disk_util=0

continue_on_error=all

rate_process=poisson

runtime=10000

[db-oltp1]

bssplit=8k/90:32k/10,8k/90:32k/10

size=28G

filename=/dev/sdd

rw=randrw

iodepth=8

rate_iops=500,500

[db-oltp2]

bssplit=8k/90:32k/10,8k/90:32k/10

size=28G

filename=/dev/sde

rw=randrw

iodepth=8

rate_iops=500,500

[db-oltp3]

bssplit=8k/90:32k/10,8k/90:32k/10

size=28G

filename=/dev/sdf

rw=randrw

iodepth=8

rate_iops=500,500

[db-oltp4]

bssplit=8k/90:32k/10,8k/90:32k/10

size=28G

filename=/dev/sdg

rw=randrw

iodepth=8

rate_iops=500,500

[db-log1]

bs=32k

size=2G

filename=/dev/sdb

rw=randwrite

percentage_random=10

iodepth=1

iodepth_batch=1

rate_iops=100

[db-log2]

bs=32k

size=2G

filename=/dev/sdc

rw=randwrite

percentage_random=10

iodepth=1

iodepth_batch=1

rate_iops=100
Now we prepare test system for mass VDI deployment. I’ve created special IP subnet just for VDI with Acropolis IPAM – AHV intercepts DHCP requests and serves VMs with IP.
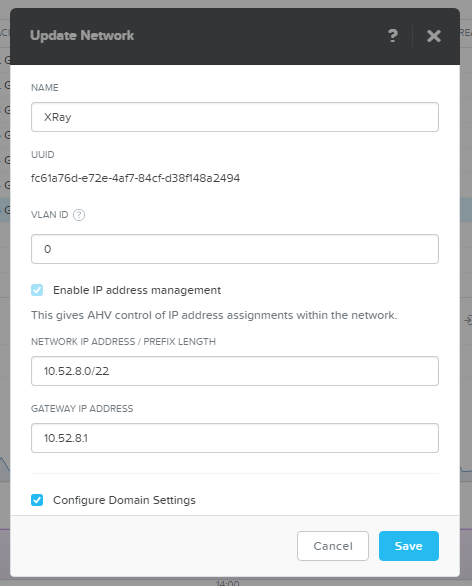
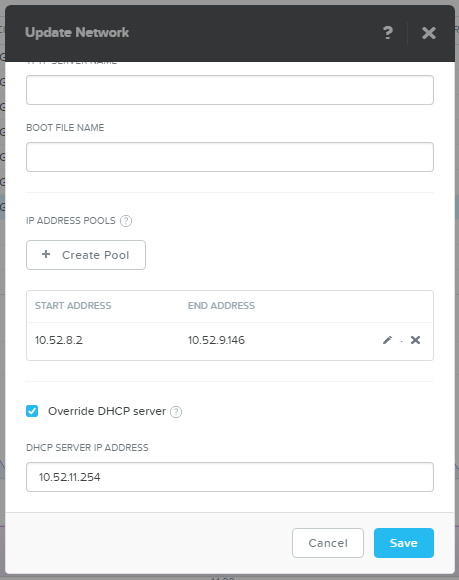
As AHV serves IP not in first-to-last orders we just create IP pool of the required size: 400 VMs, 100 per host.
Spin off 400 VDI VMs.
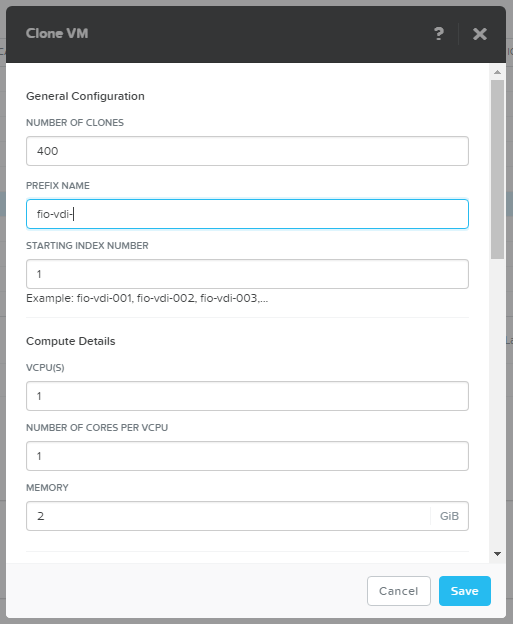
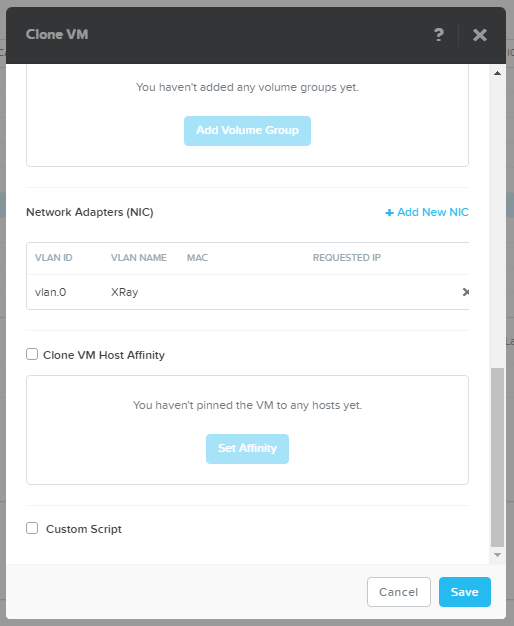
Just to create 400 VMs is already a stress test for storage.

Under 2 minutes. Good result I think.
Power VMs on.
SSH to Nutanix CVM
# acli vm.on fio-vdi-*
And… FULL THROTTLE!
SSH to FIO management
# fio –client vdi.list vdi.cfg
Now your storage systems experience 400 average office users. You can easily modify config files according to your specific case.
I’ve also posted “average” OLTP config. Let’s spin off some DBs and add the workload to VDI.
# fio –client oltp.list fio-oltp.cfg
Everything goes great! System handles workload well, numbers are great. Let’s create disaster, MWAHAHA!
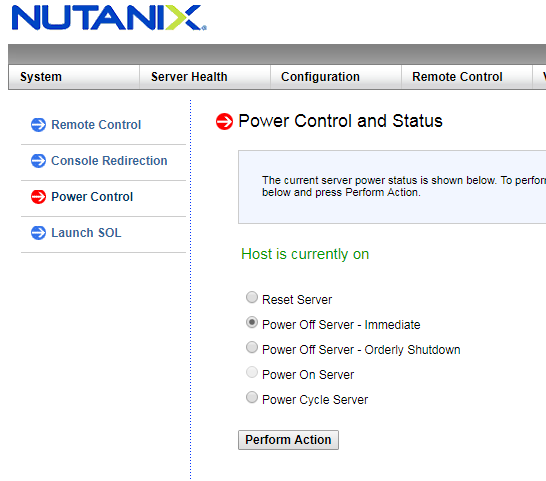
Now we have a perfect opportunity to see how the system handles fails. Pay special attention to “smart” systems with 1 and more hours delayed rebuilds. Hmmm… Host is down, not an issue, maybe. They will try to show you good numbers while test runs, but in production it can cost you a lot.
Nutanix is starting to rebuild data redundancy automatically in 30 seconds, even if it’s not a failure but a legitimate operation like host reboot during upgrade.
With such a tool you can easily test any offered storage/HCI system. Or, of course, you can download Nutanix XRay, that will test the system for you and provide nice GUI and a lot of graphs 🙂
